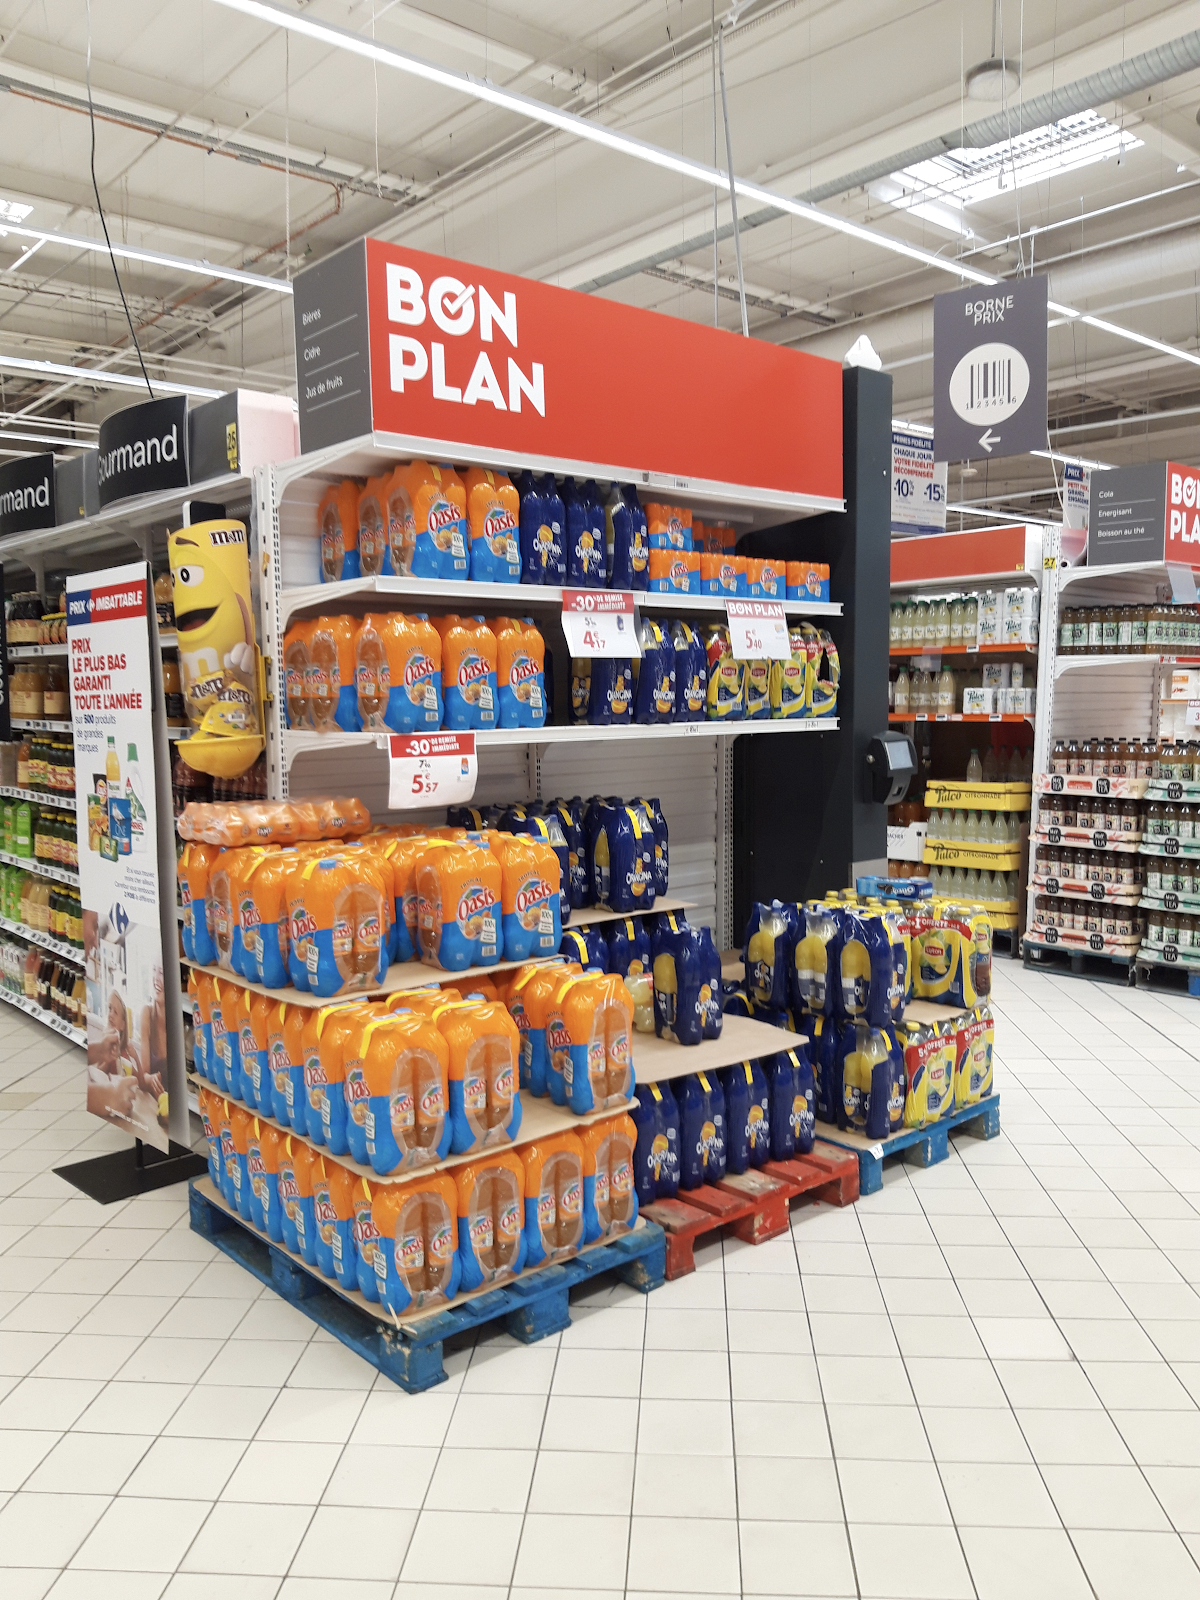
Catalogue in hand, you are in front of the discounted orange juice area, but unfortunately the orange juice you are looking for is already sold out. Disappointed? You are not the only one; not finding products advertised in catalogues is one of the major customer pain points and directly impacts the NPS. For a major grocery retailer such as Carrefour, promotions remain an important driver of traffic. Ensuring promotional products availability and delivering on our customer promise is essential.
Many factors can result in product shortages, but the lack of accurate demand forecast is a key element. Forecasting errors are costly. Ordering too much will cause high stock levels and possible shrinkage, especially on products with short shelf life. Ordering too little will result in unhappy customers and this is not an option.
In this article, we present why this forecasting problem is particularly tricky, and how we are addressing some of these key challenges in Carrefour.
An ambitious Machine Learning challenge
Forecasting for retail promotions is known to be a hard task with many pitfalls and this applies in the context of Carrefour as in any other major grocery retailer. This forecasting difficulty is mainly due to the complexity of promotional processes. So, let’s dive into it!
Promo process complexity…
Putting together a successful promotion requires coordination and close co-operation of many business lines such as marketing, merchandise, supply chain and store operations. Multiple decisions have to be made through the process starting with which products will go into catalogues, which promotional mechanisms will be applied… all the way to what quantity should be ordered from the supplier and how much should be allocated to each store to ensure that customers will find their products up to the last day of the catalogue with very little left over.
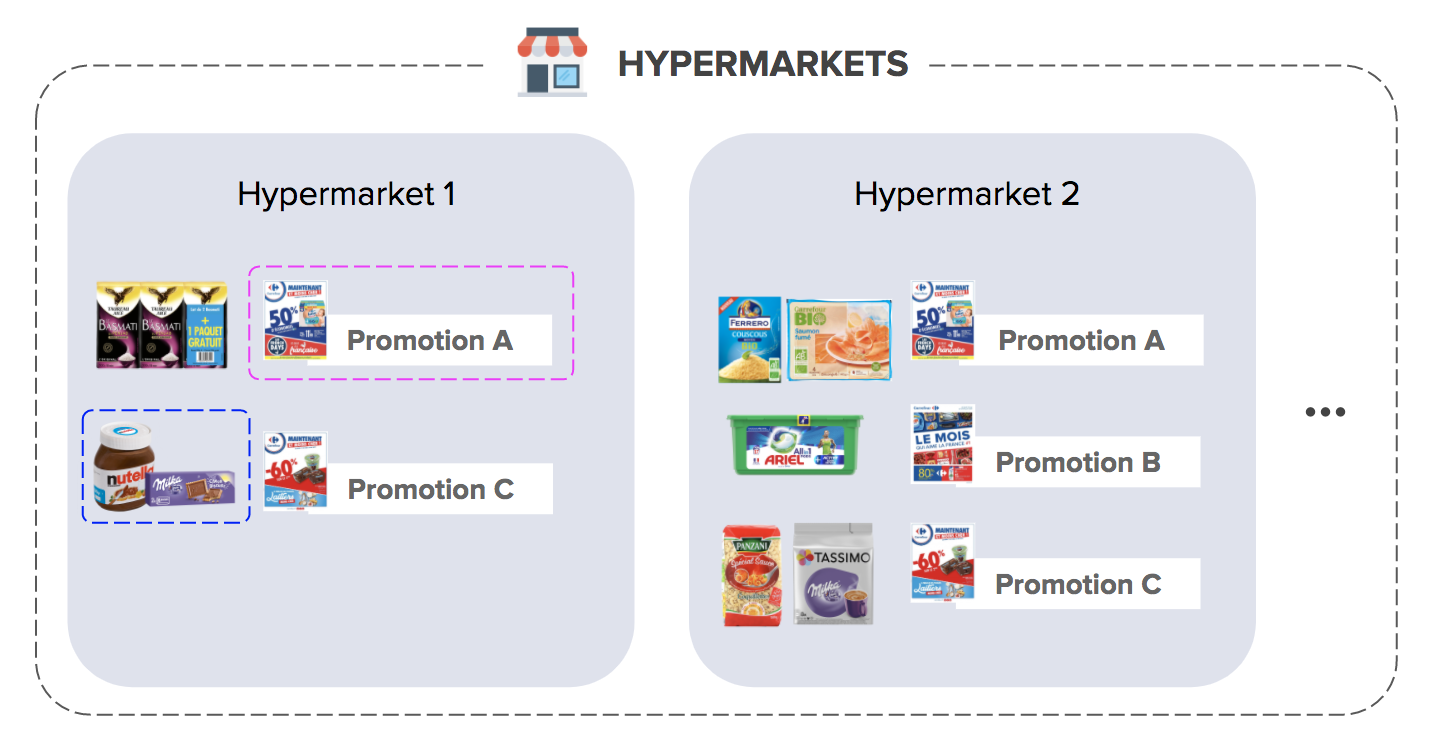
Not all promotions are created equal: there are national catalogues, regional catalogues or those related to big events such as “back to school”. While some larger stores will order every item in the catalogue, others may focus on a smaller selection.
Supply chain constraints play a role as it is nearly impossible to order the perfect quantity. Indeed the product may be available in different shipment: units by 3 in a package, and by 96 in a box along with other products.
External factors can also add complexity. For instance, a very aggressive promotional campaign by a competitor could force adjustments in initially planned promotional mechanisms, choice of products, stores or duration. All that at different points in time…
All this complexity ends up showing in the data. It is then all the more crucial to have a complete understanding of the business process and the relevant information system supporting it.
… requiring a good look ahead!
Much of this process takes place well ahead of the beginning of the promotion, and herein lies one of the key difficulties: we have to predict how much of any given product needs to be shipped to any given store, months before the Day 1 of actual sales. To put that in perspective, you may have heard about the (un)reliability of weather forecasts beyond a few days, or at most a few weeks. Imagine the challenge to get this right months ahead!
The period between the prediction day -when predictions are generated- and the forecasted day -when sales are observed- is called “horizon”. All of the modifications happening during that period make parts of the dataset unusable. For example, if the promotional mechanism is adjusted for any reason the month before the launch, we cannot use that information, as at the time of prediction, we do not have it. We are blind to whatever happens during the horizon. Making use of that kind of future information to train our algorithms is what we call a “data leakage”, and must be avoided at all costs.
The modeling approach: a focus on how we structure data
When we talk about “modeling”, we implicitly think of two things:
- The selected Machine Learning (ML) technique or algorithmic approach. In the case of Carrefour, we chose Catboost, an enhanced implementation of gradient-boosted trees algorithm developed by Yandex. Catboost handles categorical features and introduces ordered boosting reducing temporal bias.
- How we structure the data to reproduce relevant information. Many stores run many promotions, and there are many products in each promotional catalogue. To shape our training dataset, we had to build features describing those three dimensions.
Overview of the data structure for promo forecasting
As the algorithmic approach is already well documented, we will focus on the data, which is a much bigger challenge here. Below is a description of some of the features we built for our model.
Stores features
Let’s start with the basics: characterizing each store. For this, we included:
- Location, size, opening hours.
- Socio-demographic data, number of competitors in the catchment area, vacation zone.
- Share of sales of each product family in total store’s sales. The intuition is that these features help the algorithm to understand in which stores a given product is very important.
Promotional catalogue features

When engineering features, a common question is: what is the information that a human being would need to do the same job? The task at hand is promotional forecast, so we looked at the promotional data that can be found in a typical catalogue:
- The promo title, type, duration, etc.
- Start and end dates. To help the model understand the cyclical nature of such features (January should be close to December for instance), we computed their cosine and sine, along with categorical features.
- Calendar data of the promotional period, such as the number of school holidays during the catalogue, the number of bank holidays, etc.
Product features
This category can be subdivided into two sets:
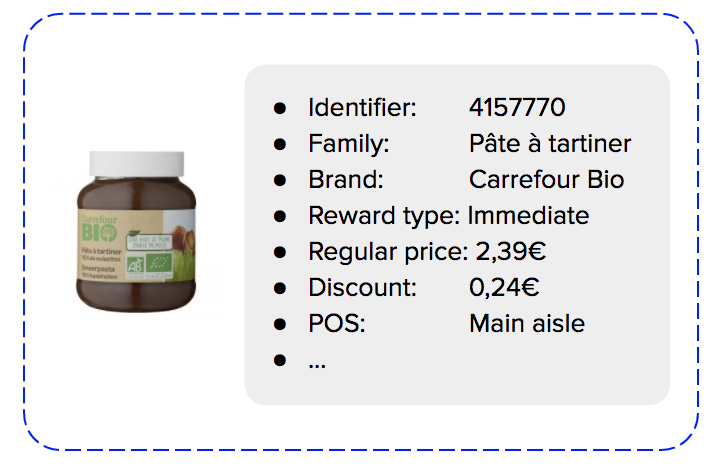
- First, simple features, composed of product characteristics that are independent from the promotion: an identifier for the product, various product categorization, its brand.
- The second type encompasses product characteristics but that may be different for each promotion, such as reward mechanism, product location in store, etc.
Dataset granularity
In theory, a model trained with those features could predict for each day of a promotion, in a store, for a product, the expected sales. To retrieve the quantity that will be sold during a two-week promotion for instance, we would only need to sum the forecasts for all the days of the promotion event.
In reality, we would quickly run into an issue: the horizon (remember, the time interval during which we cannot extract information) varies for each day of the promotion. Given that the promotion duration is variable (most of them last two weeks, but a few span over one month or more), it is not realistic to have a changing horizon for the computation of the features. To avoid such data leakage, we chose the granularity of the dataset to be ‘store x promo x product x’. The features are then computed with respect to a fixed horizon ending at the first day of the promotion.

Past sales effects
Our hypothesis is that future sales are likely to behave in a similar way as those in the past. We have therefore crafted a few features based on the past promotions, such as the average daily promotional selling rate. In fact, many parameters must be considered: the number of promotions to include and the way to select them (the most recent? the most similar?). For instance, if we want to know how the discounted Coca Cola with a loyalty reward will sell, we may want to take a look at what happened about a year ago (because of seasonality), and see whether it has already been in promotion in that store with the same mechanism.
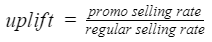
Once this is done, we compute the promotional uplift. Given a product and a store, the uplift gives us their sensitivity to promotion. The higher it is, the more sensitive is the product to promotion. It is defined as:
Cannibalisation and storage effects
The objective of this last set of features is to characterize two phenomena that are important in retail:
- Cannibalisation: having one product eating away at the sales of another one, when two items are in promotion (e.g., when Coca Cola Zero and Coca Cola Cherry are both discounted)
- Storage effect: having one product sales being affected by a previous promotion of a similar product. For instance, if Coca Cola was already on promotion two weeks ago, people may have seized that opportunity to stock up and will be less inclined to buy more even if the product is on back on sale.
Rather than quantifying the cannibalisation (e.g., strong / medium / small effect), we tried to characterize the context in which it happens, so that our algorithm can understand by itself in which situations the phenomenon occurs. Our hypothesis is that the demand is influenced by:
- The number of similar products on promotion in the same store at the same time (the more choices customers have, the higher the risk that products would cannibalize each other).
- What is the relevant ranking of each product within this cannibalisation cell in terms of its sales potential or other relevant metrics.
The cannibalisation features vary a lot depending on the cells and metrics definitions. The figure below shows a simple example.
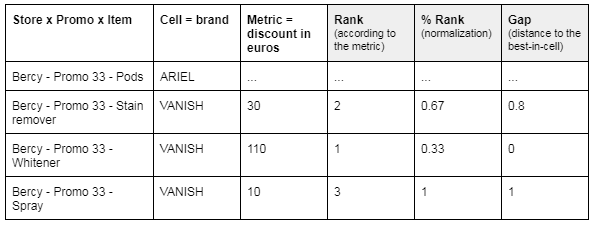
Meanwhile, the storage effect can be viewed as a kind of cannibalisation delayed in time: sales depend on the number of similar products in promotion at different depths in time (we can assume that the more recent is the promotion, the bigger the impact). The cannibalisation cell concept can therefore be generalized: instead of considering only similar products simultaneously in promotion, we will take into account all the products in promotion within a given timeframe. With these newly defined “storage cells”, the same approach is then applied to build features catching the storage effect.
Some technical tips
For the above features, there are many parameters to play with in order to try out cell definitions for cannibalisation, easily change the number of promotions used to compute the uplift, etc. We use Jinja2 library to render the final queries from SQL templates in association with a centralized configuration file.
Training our promotional forecast solution at scale (tens of thousands products, hundreds of stores) can take several hours. By using GPUs, we have divided it by 6! For horizontal scaling, the good news is that Spark support for Catboost is now also available. We plan to dig this out!
Getting business on board
Performance indicators, which can be understood by business, are key to the success of any ML project. Whether you are using metrics like R2, Forecast Accuracy (FA) or F1-score, making the business to grasp their meaning and translating them into intuitive, ready-to-consume information is always a challenge.
The “interpreter” role of data scientists comes in handy. Part of their mission is indeed to understand what really matters to the operational teams in order to find a way to convey metrics that make sense to them.
Let’s take the example of the volume weighted Forecast Accuracy (vwFA). We can break it down into positive or negative errors to isolate under and over forecasts contributions.

In our project, we found it particularly useful to:
- Consider separately the under and over forecast errors in order to get their relative importance.
- Display the average absolute errors (in number of products).
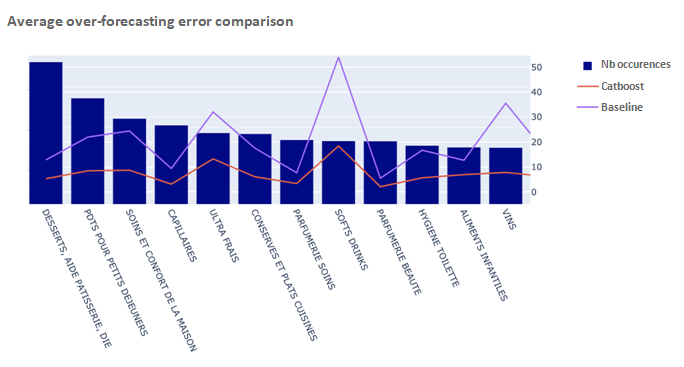
As a picture is worth a thousand words, using simple visualisations made interactions much more efficient. In the below graph we can clearly see that our Catboost model has a lower over-forecasting error than the baseline (the existing system) across all the product categories.
Model interpretability should not be overlooked. It is key for a better adoption of data and is truly the golden ticket to onboard business on the ML trip.
To sum up
Building a good model is an iterative process, where each step relies somewhat on the improvement of the algorithm and heavily on the features refinement. With this article, we wanted to put the spotlight on this second element. Despite being equally fundamental, the emphasis is usually put on the algorithmic side of ML projects, for all its shiny and attractive aspects, neglecting the precious work on the data and features. This topic was discussed in depth by Andrew Ng in one of his latest DeepLearningAI videos: From Model-centric to Data-centric AI.
Forecasting promotional demand at Carrefour remains nonetheless a complex task, partly because of the richness of the data involved. Even if we managed to outperform our baseline by 15 pts of FA, we believe that there is still room left for improvement. In order to succeed, it is important for the data teams to work hand in hand with operational colleagues to improve existing processes, enriching the data that fuels our algorithm.
Check the other articles related to data projects.