We all love spending hours on the Internet, be it social media, watching a movie in streaming or doing research for professional purposes. The past few years, the needs and wants of websurfers have evolved, becoming more and more demanding. We tend to underestimate the deep influence of the almighty Google on our way of navigating the Net. When you type “fluffy pancakes recipe” on Google, you expect an immediate answer, right?
Search engine standards have imposed a “now or leave” mindset in the vast majority of the population. And this is especially the case for digital natives: After three seconds of waiting time, 53% of visitors will leave the site they are browsing. This is particularly true for digital assets that require customers to follow a process, as it is the case in retail (the well-known “funnel” from awareness, to product discovery, basket build-up and payment). Hence, ensuring high performance of e-commerce becomes a must to keep customers engaged during the checkout process (and afterwards too).
In this article, I will do my best to deep dive into why web performance matters to better serve customers.
Why does web performance matter?
What is the impact of delays on the top line? In 2006, Amazon observed a 1% decrease in revenue for every 100 ms increase in load time. Walmart measured an increase in conversion up to 2% for every second of improvement in load time in 2013. AliExpress, during 2016, reduced load time by 36%, which led to a 10.5% increase in orders and a 27% increase in conversion for new customers.
According to a recent Google study, performance is the top UX priority for users. However, as digital portals and apps are continuously developing intelligent features that require more and more computing power and network bandwidth, loading time tends to increase, hence hindering fast and smooth experiences.
Google understood it years ago. Since 2010, web performance is one of the criteria used by its algorithm to rank pages. In 2021, Google will introduce new performance metrics called “Core Web Vitals” to enrich their SEO algorithm.

Web performance metrics
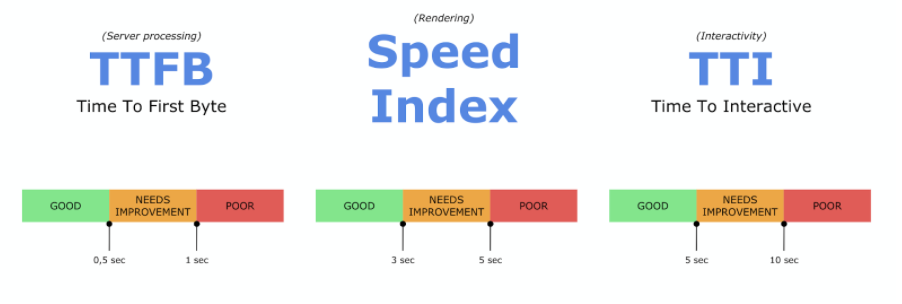
The bread and butter of web performance revolves around three key metrics: Time To First Byte (TTFB), Speed Index and Time To Interactive (TTI). The indicators help us to understand rendering times, user interactivity and latency.
1/ TTFB
TTFB tells us how long it takes for a request to be sent by the browser to the server through the network, be processed and have the result delivered back.

The goal is of course to keep TTFB as low as possible. It can be reduced by optimizing the web application, increasing the power of servers or adding cache layers such as a Content Delivery Network (CDN).
2/ Speed Index
Speed Index is a well known metric used to qualify the rendering process. The key point here is to understand how fast the browser is displaying the different elements of the page and when users will be able to interact with it.
The Speed Index translates the effectiveness of the rendering process into a score, usually between 1,000 and 6,000 (the lower, the better). This metric does not only measure the full page rendering speed, but it also takes into consideration the proportion of the screen rendered over time.
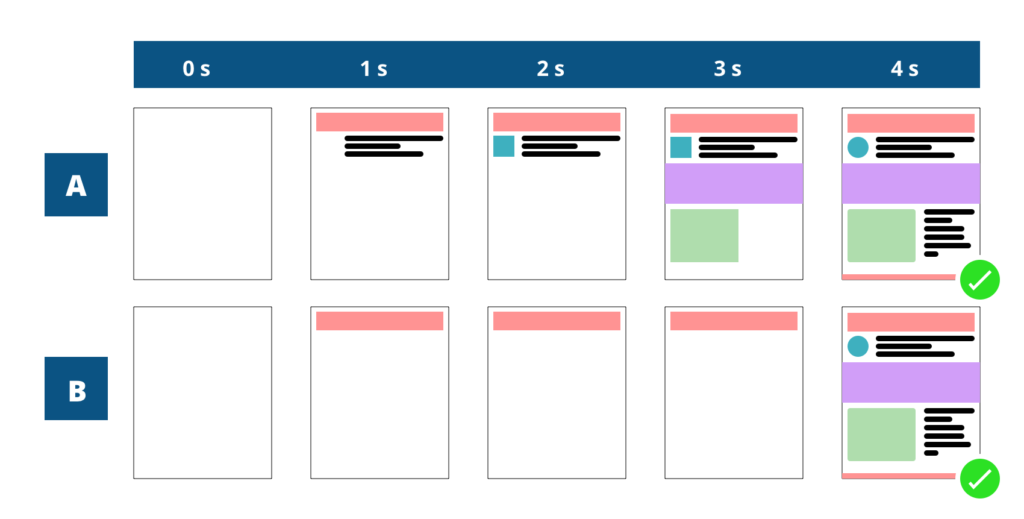
Optimizing the critical rendering path through a progressive display of elements becomes critical. The illustration below helps us to better understand the customer impact. Page A and page B start to be displayed at the same time and become complete simultaneously. However, page A provides a drastically better user experience as users will see it filling up gradually whereas, with page B, they will get an almost blank page for a while.
3/ TTI
Having a low Speed Index is not enough, because of the smart behaviour and dynamic features on the page which the browser will have to process. These features usually lead to some idle time on the user’s computer during which the user cannot interact with the page. This is what TTI measures: How long does it take for a page to become fully operable by the customer.
There are many other web performance metrics. While some focus on rendering and Speed Index, others on interactivity with TTI. Companies should choose the most appropriate one linked to their digital strategy. However, they have to keep in mind that none of them will provide the whole picture. The analysis of these KPIs will help to identify the right improvement opportunities (compression, reduction of CSS, avoiding redirections, leveraging caché, monitoring third party add-ons…).
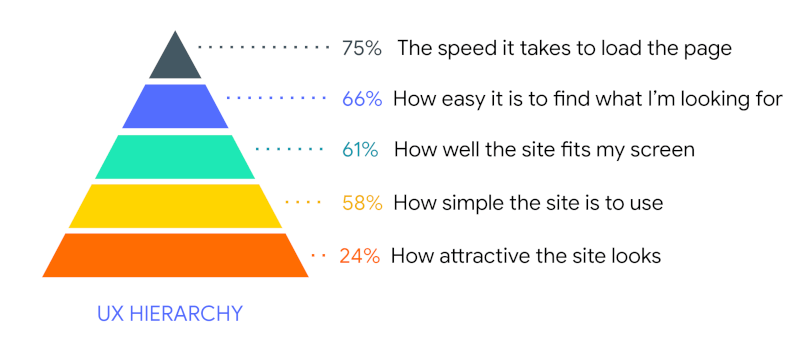
In Carrefour, following the example of Google’s “Core Web vitals”, we defined a global scale so everyone can understand the impact of these metrics: When values are good, when improvement is needed and when we are doing really bad!
Current values are based on the history of our e-commerce operations, combined with some inspiration from web performance rankings.
Web performance tools and ways of working
A wide range of tools can be used to capture the previous metrics. They can be structured tools in three main categories:
- “Unit testing” tools, which allow to perform discrete quick tests on a web page while developing it.
- “Synthetic monitoring” tools, which help to follow metrics over time with dedicated probes. These types of tools are easy to implement, don’t cost much and provide good inputs to start working on web performance.
- “Real User Monitoring” (RUM) tools that also enable continuous tracking of metrics over time measuring everything directly on the user’s browser. Those are web performance Rolls-Royce tools which provide real user detailed metrics.
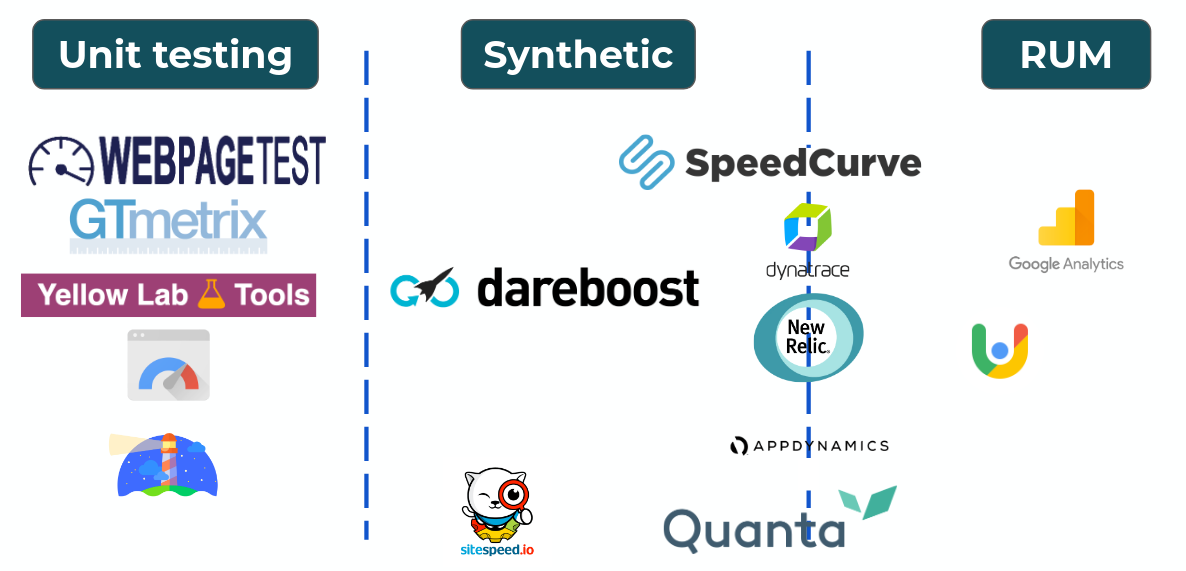
Among these, Google provides a lot of information and tools, from unit testing with the Chrome Toolbar and site speed to advanced RUM with CrUX.
In my opinion, starting with synthetic monitoring coupled unit testing capabilities embedded in the engineering pipeline is a good choice. It is easy to get lost in the complexity of RUM.
Carrefour chose SpeedCurve as its synthetic tool. Firstly used in France, it is now deployed in all Carrefour countries. Why? SpeedCurve offers a variety of advantages:
- A SaaS solution that can be deployed super fast.
- Worldwide available probes to avoid injecting artificial latency during the measurement process.
- Native and secure APIs to easily integrate performance metrics inside other tools (e.g., Google Sheets).
- Fully configurable simulation of devices and network. E.g: simulate an iPhone with Safari on a 3G network or a Windows computer with Chrome on a fiber line.
We first started by monitoring three of our three critical pages (Home, Product List Pages and Search Page) five times per day to capture the highest traffic periods. Then, we moved to the analysis of more advanced scenarios such as mobile devices with poor network bandwidth, more specific pages of the funnel, etc.
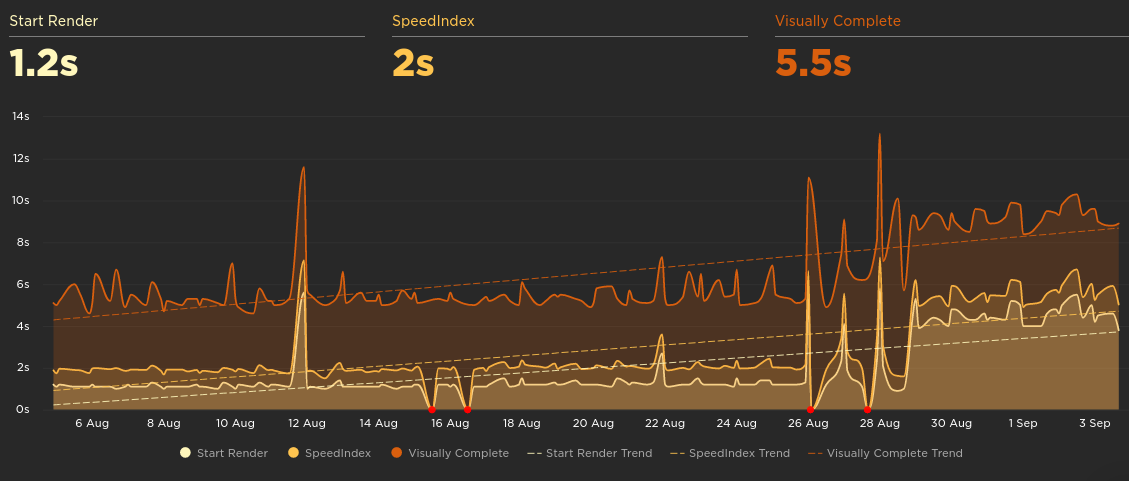
On top of being a measurement tool, SpeedCurve provides a lot of features to dig inside the rendering process and help us find optimizations. For example, the following chart shows three different rendering metrics over the time. As you can see, there is often a correlation between similar metrics. If “start render” increases, “speed index” and “visually complete” do the same. This kind of visualization is useful to identify unusual behaviour or confirm a global deterioration (what went on on August 29th ?).
Using the same tool in all Carrefour countries helped us to compare and rate our websites while sharing a “common language” for web performance. It also allowed us to share international best practices and tips within our e-comm platform community, leveling up the skills of the different countries. This is a good illustration of one of the pillars of the technological transformation of Carrefour: Developing global tech capabilities and innovation leveraging the international footprint of the Group and reuse them when it makes sense.
As a conclusion, let me say that web performance may be perceived as a “one time job” where the work undertaken to improve the performance stops abruptly after the publication of the page. On the contrary, considering the site as a platform in perpetual movement can bring much better results. As the digital portal acquires new features, welcomes new partners and implements new value propositions, the web performance agenda shall to be tweaked to adapt to the new context and better serve customers.
In fact, web performance could be thought of as a continuous PDCA process in which continuous measurement, analysis and implementation of corrective actions becomes a daily -and fun!- habit.
This article has been developed with the help of Stéphane Rios CEO of Fasterize.
Check our other tech projects on Horizons.